
Prediction Markets: Right Calls, Wrong Returns?
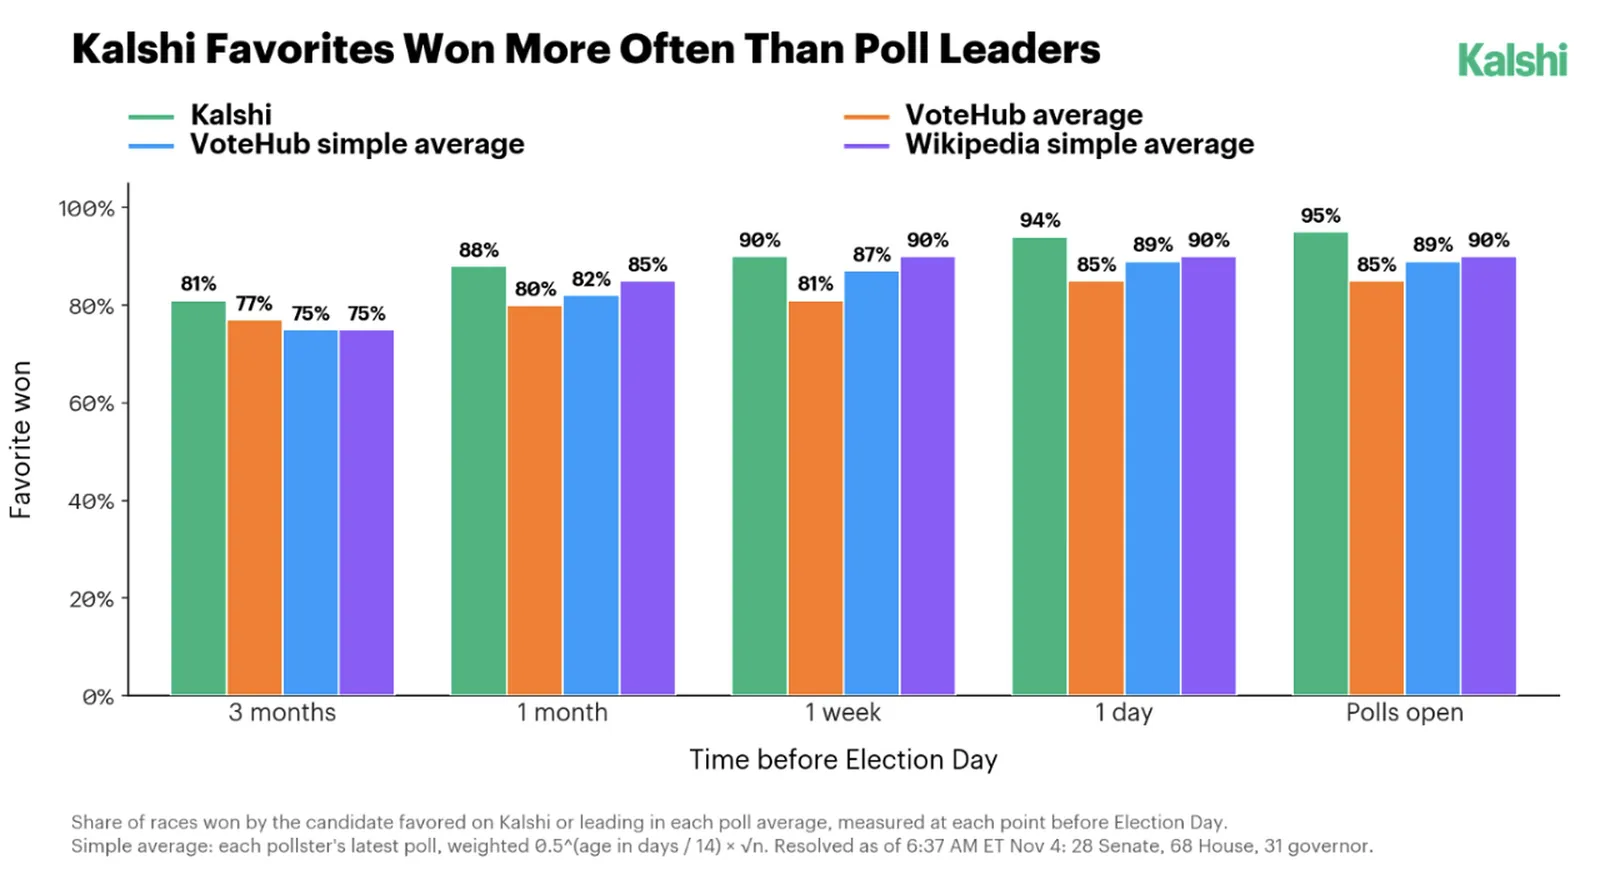
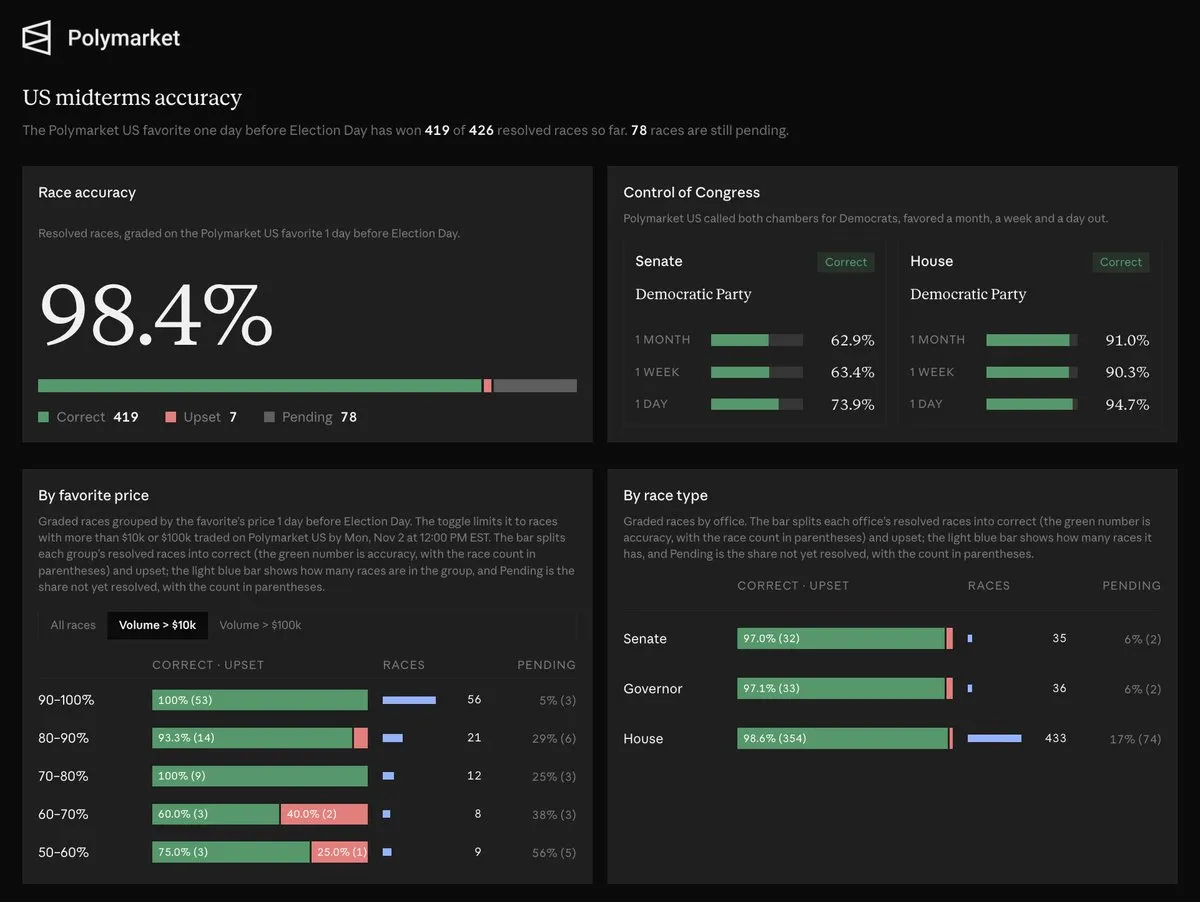
According to each platform's own figures, Kalshi's favorite won 479 of 487 resolved races, with 8 misses. Polymarket reported 419 correct calls out of 426 resolved races, with 7 misses and another 78 races still pending. Both reported a hit rate of about 98.4%. These are self-reported numbers, counted at different times.
Both also said in their reports that they called control of Congress correctly. Kalshi gave Democrats a 74% chance of winning the Senate, compared with 73.9% on Polymarket; for the House, the figures were 94% and 94.7%, respectively. Democrats won both chambers.
Individual races tell a different story. These figures all come from Kalshi's November 2 noon snapshot:
| Election | Democratic candidate | Market-implied probability | Result |
|---|---|---|---|
| South Carolina Senate | Annie Andrews | 33% | Won |
| Texas governor | Gina Hinojosa | 40% | Won |
| Iowa Senate | Josh Turek | 52% | Won |
At 33% and 40%, Annie Andrews and Gina Hinojosa were both considered more likely to lose than win. Both won; in Texas, Hinojosa defeated incumbent governor Greg Abbott.
Josh Turek is a different case: 52% was close to a coin flip, and at that moment, he was slightly favored.
A lower probability usually means a cheaper contract and a larger potential return if you win. But before the outcome is known, you can still lose everything you put in. We'll calculate the odds and returns after fees below.
So what does that 74% on the screen mean? And if you buy at that price, how much can you make after fees?
How to read prices as probabilities
A prediction market lets people trade contracts on whether something will happen.
Take Senate control. A contract might pay $1 if Democrats win the Senate, and $0 if they don't.
Suppose one contract costs $0.74.
A buyer who thinks the probability is above 74% sees a bargain. A seller who thinks it is below 74% sees an overpriced contract. The price they agree on becomes the market's estimate of the probability.
When a contract pays $1 if you're right and $0 if you're wrong, a price of 74 cents implies roughly a 74% probability, before fees.
This is the view of people willing to put money on the outcome, not a poll. Those traders do not necessarily represent the electorate.
One distinction matters: the price reflects the probability of winning, not the share of votes.
For example, two days after the election, Mississippi had counted 95.6% of the vote. Democrat Colom led by just 1,724 votes, roughly 0.2% of the votes counted. Yet the market priced him at 97%.
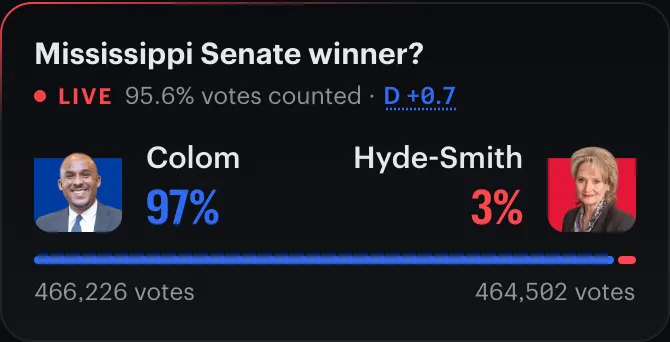
Kalshi's live market, captured November 5, 2026. Vote counts and prices reflect that moment.
These numbers do not contradict each other. A small margin means the vote is close; 97% means traders think the remaining votes are unlikely to reverse it. The race had not been officially called when the screenshot was taken.
How much do you make after fees?
Using the same 74% chance of Democrats winning the Senate, suppose you buy 100 contracts at $0.74 each, for a total of $74. If Democrats win the Senate, each pays $1 and you receive $100. If they don't, you receive nothing.
Before fees, turning $74 into $100 gives decimal odds of about 1.35. That includes your original stake; the profit is $26.
Now add fees. Kalshi's general fee formula is 0.07 × contracts × price × (1 − price), rounded up to the cent. Here that is 0.07 × 100 × 0.74 × 0.26 = 1.3468, so the fee is $1.35 and your total outlay is $75.35, leaving a profit of $24.65 if you're right.
Return after fees = profit ÷ total outlay = $24.65 ÷ $75.35 ≈ 32.7%.
Using the same approach, here are the three examples, assuming you buy 100 contracts each and hold them until settlement. All amounts are in US dollars.
| Candidate | Price per contract | Fee | Total outlay | Payout if they win | Profit | Return |
|---|---|---|---|---|---|---|
| Annie Andrews | $0.33 | $1.55 | $34.55 | $100 | $65.45 | 189.4% |
| Gina Hinojosa | $0.40 | $1.68 | $41.68 | $100 | $58.32 | 139.9% |
| Josh Turek | $0.52 | $1.75 | $53.75 | $100 | $46.25 | 86.0% |
A lower price means a larger return if you win. If you lose, though, your entire outlay is gone. These are returns on winning trades, not annualized returns, and exclude deposit fees, withdrawal fees, and taxes. Selling early requires a separate calculation using your sale price and trading fees.
What if you spent up to $10 on every race?
Instead of picking underdogs, what if you simply bought the favorite? Using Kalshi’s historical data, we simulated buying the most favored candidate or party in each race at noon Eastern on November 2.
Each race had a $10 cap including entry fees. We bought only whole contracts and kept leftover cash rather than moving it to another race.
We screened out thinly traded markets and stale quotes. The selected contract needed more than 1,000 contracts traded in the preceding 24 hours, and quotes no more than one hour old for every candidate in the race. That left 140 races, a different sample from the official 487-race statistic above.
The provisional result as of the evening of November 5: a $20.83 loss after trading fees, or −1.54%.
| Item | Result (USD) |
|---|---|
| Races passing the screen | 140 |
| Provisional wins / losses | 116 / 24 |
| Total outlay, including entry fees | $1,349.83 |
| Settlement payouts, including estimates | $1,329.00 |
| Net profit / loss | −$20.83 |
| Return after fees | −1.54% |
Of the $1,400 budget, $50.17 remained unspent because we bought only whole contracts. That cash is not a loss.
This is not a final settlement result. At 10:16 p.m. Eastern on November 5, 118 races had settled; among the remaining 22, we provisionally counted 13 positions priced at 90% or higher as wins and the other nine as losses: seven below 5%, one at about 8.0%, and one at about 25.5%.
Those two could still change the conclusion. If the 25.5% position wins, the loss shrinks to about $3.83; if both win, the result becomes a profit of about $11.17. We'll update these figures when actual results arrive.
We used bid–ask midpoints to identify pre-election favorites and current implied probabilities, and the ask price for simulated purchases. The calculation includes entry fees but does not verify whether historical order-book depth could fill each purchase, and excludes slippage, deposit and withdrawal fees, and taxes.
These 140 races include only actively traded markets, which leaves out many one-sided races, so the hit rate is lower than the 98.4% above. Even with 116 provisional wins—a hit rate of about 82.9%—the strategy lost a little money. Buying favorites can mean small gains on each win, which a few losing positions can erase.
Takeaways
Prediction markets got the direction of congressional control right in these midterms, but some underdogs still won. A low probability does not mean an event cannot happen.
A contract that pays $1 if you're right and $0 if you're wrong can be read as a probability: 74 cents implies roughly 74%, not a 74% vote share. To calculate returns, include both the purchase cost and fees. In the 74-cent example, a win returns about 32.7% after fees; a loss wipes out the entire outlay.
If you'd like to explore prediction markets yourself, you can use my referral links: Kalshi, Polymarket, or Polymarket US.